
Reading Forex Trading Charts
By Content-mgr - on March 16, 2016Studying forex trading charts for detecting entry and exit points. It’s a task possible in many different ways, and on various time frames. Though a tough one!
Making the Studying of Forex Trading Charts Easier to Handle
Studying forex trading charts for the purpose of detecting good forex signals is quite an overwhelming task. Because different markets and different time frames of the same market never seem to agree. Forex trading charts are ambiguous, and confusing. There is no doubt that many traders lose on many of their trades because of this confusion and chaos. But studies have shown that that’s the way forex charts work, and things couldn’t be otherwise. Because of the difference of opinion which actually makes the markets work. As well as the different objectives even among buyers, or among sellers, markets trade in confusing ways. Moreover indicators used on these charts are just as confusing, and seem to confirm any possible scenario. The good news however is that markets are not totally random, and good signals can be possible to figure out. For one it is possible to use classic chart analysis and indicators in interrupted mode, rather than continuous mode. This means every trading theory and indicator is bound to work say 50% of the time, and fail during the other 50%. By careful crosschecking it is possible to detect what phase the theory or indicator is in, and act accordingly. It is difficult to use an indicator with great faith for one week. And then the next week to have to ignore or fade its signals. But that’s the way all indicators and theories work. And it is what keeps them working during the good 50% cycle. Even if an indicator could start working 100% of the time, it would make the market one sided, saturated, and impossible to trade, hence there would be no market anymore. If there is a market which is possible to trade, it is exactly because no indicator can beat it 100% of the time.
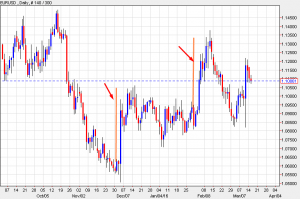
Daily Forex Trading Charts
Daily forex trading charts are the key to evaluating all theories and indicators, even for the purpose of day-trading. And also for trading on forex news. This is because the daily chart captures entire time zones around the global currency market, the high volume times, and the closing times which are very important. Weaknesses in theories and indicators can slip through your evaluation if all you are using is 10 minute or 1 hour charts. An indicator can work perfectly well throughout such charts, and for a long time. But on the daily chart, you can see how the market reacted to factors such as volume and LSS pivots. This is data specific to the day in question. LSS pivots can also be weekly or monthly based, and relevant to a single day’s trading. The daily chart is important in any kind of test or evaluation process. All other time frames fail to address inherent key weaknesses and so they go on unnoticed. The daily chart provides more clarity and carries the most weight out of all time frames.


 First Deposit Bonus
First Deposit Bonus | Phone Verification | First Trade on us | Account Verification