
Guide to Best Tools for Forex Charts
By Content-mgr - on December 1, 2015With the growth and development of foreign currency trading worldwide, largely through networks of forex brokers, the unique tool of forex charts has been authored and refined. Learning how to interpret forex charts is a basis for understanding what is forex trading, to maximize your trading experience. By maximizing this intuitive visual resource, you can make your foreign currency trading a more professional endeavor.
The Basics of Forex Charts
- Up-to-date data — In order to be of value, forex charts must be current. The logic of charting is that past price movement has value in predicting future prices and that recent history is more significant than previous periods. So forex brokers have an incentive to provide their clients trying to understand “what is forex trading” with current forex charts.
- Defining your forex charts timeframe — Market-determined prices, being freely determined by random stochastic processes, manifest behavior specific to them, apart from any larger secular trends and influences. Thus, the strategy for each trade will depend on the duration expectations held at its outset. And strategy is time-unit dependent: patterns and meaning in forex charts are functions of the units in which they are denominated. Whether the issue is a candlestick analysis or identifying in which forex charts pattern a price series is currently oscillating, the unit timeframe is of critical importance.
- Practice your strategy — The essence of forex charts is identifying foreign currency trading price patterns with sufficient exactness and robustness that a profitable strategy can be devised. And while real-world conditions are unlikely to be exactly replicated by simulated or demonstration scenarios, practice sessions should precede any real trading attempts with a forex broker. To answer what is forex trading, you should practice on both past and present data to see if your understandings survive the reality test.
- Learn new strategies and chart structures — The evolving nature of market movements requires that participants continually refine and reexamine their methodologies and understandings. The only constant is the presence of change. Still, no forex charts trading arsenal is complete without a mastery of the basic common tools:
- Candlestick representation — A bar on a candlestick chart shows the open, close, high and low prices for the selected period. The body of the candle shows the open and close prices where the wicks show the high and low prices.
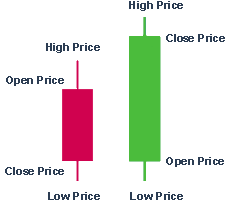 If the closing price is greater than the opening price of the previous candle, then the candlestick will be green. If otherwise, the closing price is less than the opening price of the previous candle, then the candlestick color will be red. Candlesticks simply make it easier to see if the trading period ended up or down and they also contain additional information.
 - Fibonacci retracement indicators — These virtual thresholds are horizontal lines to indicate areas of support or resistance at the key Fibonacci levels before market movements continue in the original direction.
- Utilize moving averages to gain longer term perspectives. Historical data is the essence of forex charts and employing averages is the single best use of data to understand what is forex trading.
- Candlestick representation — A bar on a candlestick chart shows the open, close, high and low prices for the selected period. The body of the candle shows the open and close prices where the wicks show the high and low prices.
Enjoy our regulated platform


Write a comment
Special Offer
 First Deposit Bonus
First Deposit Bonus | Phone Verification | First Trade on us | Account Verification