
U.S. stocks closed higher to record their sixth gain in seven sessions in muted trading, buoyed by gains in technology shares as expectations the Federal Reserve will cut interest rates next week remain elevated.
U.S. stocks closed higher to record their sixth gain in seven sessions in muted trading, buoyed by gains in technology shares as expectations the Federal Reserve will cut interest rates next week remain elevated.

Gold prices fell over 1% as investors took profits following a six-week high in the previous session, while they awaited key U.S. economic data ahead of the Federal Reserve’s policy meeting next week.

Strategy, the world’s largest public Bitcoin holder, is creating a $1.44 billion US dollar reserve to support dividend payments on its preferred stock and interest on its outstanding debt. Alongside the launch of the reserve, Strategy disclosed an additional purchase of 130 Bitcoin, bringing total holdings to 650 000 BTC.
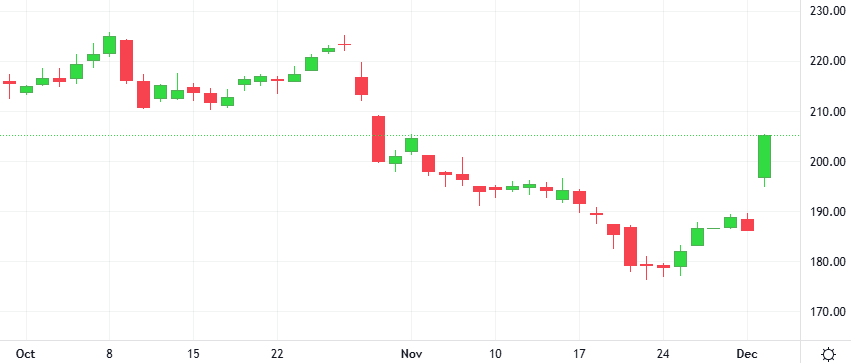
Tesla registrations in several key European markets plunged in November from a year earlier as the U.S. EV maker continued to struggle to stem market share losses despite rolling out new versions of its best-selling Model Y.

Tesla registrations in several key European markets plunged in November from a year earlier as the U.S. EV maker continued to struggle to stem market share losses despite rolling out new versions of its best-selling Model Y.

Investors will look in the coming week for signals about profitability for AI companies, as well as the broader economy’s health, to steady the U.S. equity market. Stocks rebounded last week from their biggest pullback since April, helped by a firming conviction that the U.S. Fed will cut interest rates in December.