Some Simple and yet Good Forex Indicators Traders Can Use
By Content-mgr - on March 7, 2016Traders can use simply forex indicators in slightly more complicated ways. So that there is no need go for the latest indicators, where ambiguity is greater.
Simple Forex Indicators Traders of All Levels Use
Forex indicators range from anything to do with momentum, price, highs and lows to many more formulas where the output graph is continuously plotted. Forex charts provide great insights into momentum and trend development. So the idea is to look for when great divergences occur between short term and longer term factors. Or for divergences between fundamentals and momentum. Both of these concepts can work in many time frames. The divergence between fundamentals and momentum is more long term, and much more difficult to figure out. But it is there most of the time. The global forex converter mechanism is such, that divergences of all kinds naturally develop, because the market is inefficient to some extend. Moreover we all know markets are volatile more or less, each day. This is because market participants cannot agree on price and find common ground. Divergences are simply the result of prolonged disagreement, where the market moves for a while on momentum, but some important data is not being priced in for a while. Inevitably, that data is fully priced in, and the market reverses, so as to catch up with reality.

Technical Forex Indicators
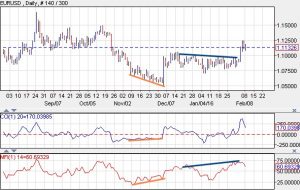
Technical forex indicators are oscillators such as RSI (Relative Strength Index), CCI (Commodity Channel Index), MFI (Money Flow Index), and more. The idea here is that at least one of these indicators will diverge relative to market price, and the market will, sooner or later, end up moving to the direction hinted by the diverging indicators. This technique works great on 30 minute charts or longer, and it helps traders of all kinds get advance warning for imminent price reversals. You don’t need to run any absolute numbers through your forex calculator to make use of these divergences. As they are simply visual divergences, and the market has the tendency to follow the single diverging indicator, and not the majority of other indicator that happen to be neutral or confirming recent market action. That is the magic of divergences, and it works on all time frames that are 30 minute based, or longer. Traders use more methods together with these indicators, so as to be able to pinpoint the exact time where the market will likely reverse. As indicators can only warn of a divergence, but they cannot provide precise timing. On the daily chart, some of these pinpointing techniques are based on high/low point analysis, and candlestick patterns. The Harami candlestick pattern is only one simple reversal pattern which may appear in such cases. There are many more, and all of them appear on the charts. Candlestick and high/low analysis is not reliable if one zooms in too much on the charts. Ideally, one doesn’t want to zoom in closer more than the four hour chart.
 First Deposit Bonus
First Deposit Bonus | Phone Verification | First Trade on us | Account Verification


