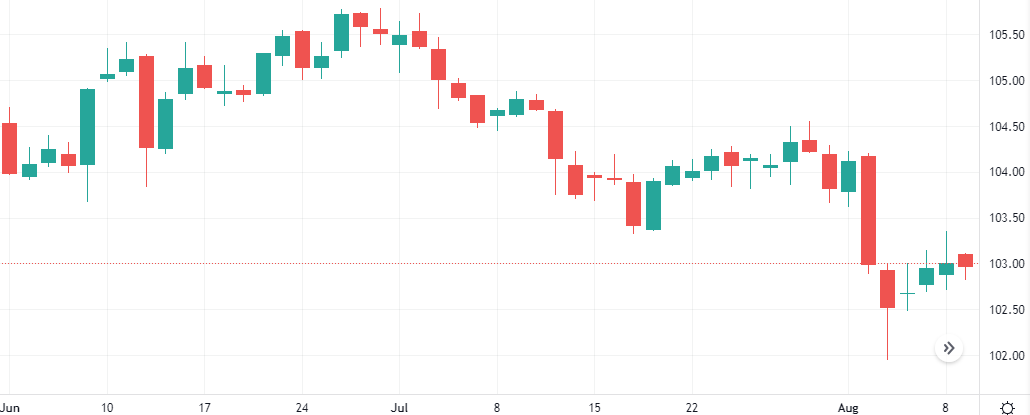
What Is the Secret of Meme Stocks’ Popularity?

The previous year, and the year before it, stand out in history not only because of the pandemic and ubiquitous lockdowns. They also gave rise to so-called meme stocks that have often managed to take the global stock markets entirely by surprise. Like none of the other stocks, meme stocks have the power to rattle the markets in several days or even hours and can gain value with unprecedented speed. Read on to learn what meme stocks are and how they succeed in capturing investors unawares. Find out how people earn money by investing in meme stocks and whether you should follow their examples.  

What Are Meme Stocks?

Meme stocks have two significant characteristics. They skyrocket in price in an extremely short period: hours or days. Their jump is generated by a sudden flurry of interest online or on social media and subsequent mass purchases among small individual investors.

The name of meme stocks, when translated from ancient Greek, reveals their essence. The word “mimema,” from which the word “meme” comes, means “imitated.” The concept was introduced in 1976 by British evolutionary biologist Richard Dawkins in his work The Selfish Gene and refers to a unit of cultural information spread by imitation.

Understood this way, memes are replicated and transmitted from one person to another. Memes evolve, mutate, and undergo natural selection, becoming popular among the masses. Memes are transmitted in verbal, visual, written, or electronic communication, such as through conversations, books, media, e-mail, or the Internet. Memes gain the widest popularity within a culture.   

As traditional investors often point out, the sharp advance of meme stocks is occasioned neither by business fundamentals nor their strong performance. In their eyes, meme stocks climb on the whim of people expressing their opinions on social media channels. Often, people conspire to push a stock’s price up to reap quick rewards from its increase.

Investors who look kindly at meme stocks say that what counts in investing is the surging stock price. No matter what the fundamentals are, a business should be deemed strong if a stock is supported by the multitude and grows. They also remind the detractors of meme stocks that the proof of the pudding is in the eating: if people earn money by investing in meme stocks, these stocks should be appreciated.

How Did It All Start?

The first meme stock, video game retailer GameStop, emerged in the summer of 2020, several months into the pandemic. One individual began to share his opinion about GameStop stock on Twitter, YouTube, and the subreddit r/wallstreetbets. In his posts, the person explained why a combination of high short interest from firms betting against a company and a GameStop business, in those times highly unappreciated, could bring handsome profits to investors.

In the wake of his posts, the former CEO of Chewy.com, Ryan Cohen, purchased 10% of GameStop shares, which became widely known. After Cohen had joined the board of directors, GameStop surged to $20 per share. Immediately after this, the value of the company’s stocks doubled, celebrating the growth of 8 times since the first posts about the company appeared on the Internet.  

Several months later, the short squeeze suggested in these posts occurred for real, with the price of GameStop shares shooting up to $500 amid panic purchasing. Hedge funds suffered the most from the short squeeze, with some announcing bankruptcy. Other forces then conspired to help the meme stock movement get off the ground. During the pandemic, people invested exclusively online, and numerous trading apps were brought together to enable the appearance of meme stocks.  

What Are the Advantages of Meme Stocks?

Owners of meme stocks can have certain benefits when a flurry of purchasing activity boosts their price:

·         A possibility of having high returns in a short period;

·         An ownership stake in a new investment idea;

·         As most investors in meme stocks are young people active on social media channels, the meme stocks movement might have a long, eventful career.

What Are the Disadvantages of Meme Stocks?

As with everything in life, meme stocks have a dark side. People investing in them might face serious problems:

·         Just as they go up quickly, the prices of stocks, hyped on social media, might speedily go down.

·         Short-term stock prices are driven by supply and demand and are unpredictable. They might sink as quickly as they soared.

·         Some meme stocks do not trade on fundamentals, which might push their price in the opposite direction and cause investors to incur losses.

What Are the Most Famous Meme Stocks?

In addition to GameStop, other companies are qualified as meme stocks. Like GameStop, these stocks were discussed on social media, which raised their prices amid frantic buying by online investors. Many of them struggled before climbing with the assistance of social media. The most famous among these meme stocks are the following:

·         Blackberry

·         Nokia

·         Palantir

·         Bed Bath & Beyond

·         Virgin Galactic

·         AMC Entertainment

There are also meme digital coins. The movement in the cryptocurrency market started with the launch of Dogecoin, created as a joke in December 2013. Shiba Inu then followed and spawned a whole new category of cryptocurrencies. Now meme crypto coins include MonaCoin, ERC20, Banana, Wownero, and Zombie Inu and have a market capitalization of $29,276.020.

How to Invest in Meme Stocks?

You can easily diversify your portfolio if you plan to trade meme stocks since meme stocks comprise a variable category. Money can come to you from various places. Or, if you do not aim to build a diversified portfolio, you may simply trade ETFs managing a portfolio of meme stocks popular on social media.  Bear in mind, however, that meme stocks can be particularly volatile. Be prepared to continue investing more over time.

The power of the public has never been stronger than now. With the help of social media and the internet, people can boost the prices of their favorite stocks within hours. It is worth keeping an eye on conversations about stocks initiated on social media channels because they may quickly bring them up and offer meme stock lovers valuable earning opportunities.

Xtrade – Overview

Xtrade : An Industry Leader and Innovator

XTrade is a widely acclaimed platform provider for Contact for Differences (CFDs) , delivering trading facilities for shares, forex, cryptocurrencies, commodities,  and indices, alongside innovative trading technology.

Who We Are

Our awards speak for themselves louder than any word. But here are a few words you might be interested to hear:

Trading financial instruments are in our DNA. For more than 20 years, Xtrade has helped clients to make trading decisions, access liquidity, and manage risks. We connect counterparties with market-leading traditional trading of CFDs on shares, commodities, forex, and indices. Our institutional strength, practical expertise, comprehensive technology, and unparalleled network enable us to deliver a powerful global trading platform when and where our clients need it. Xtrade offers around-the-clock support and delivers world-class solutions to its clients in more than 25 countries.

We provide a sophisticated trading platform available on the Web and Mobile. It allows our clients to manage trading activities from deposit to withdrawal, from any place they are in the world.

Why Trade with XTrade?

  • Strong financial resources and regulatory oversight

By establishing solid relationships with many of the biggest international banks, we are able to ensure our clients receive a first-class trading experience. This has also enabled us to expand our client base, generate increased trading volume and provide vast liquidity to our clients at superior prices. Our ongoing and continual expansion of financial service offerings — including multi-language support, multi-currency and multiple payment methods — ensures that our customers enjoy a unique trading experience.

  • Competitive pricing and trade execution

We have worked hard to ensure our pricing always remains competitive and transparent. To minimize buy/sell spreads and automate trade execution, we have devoted over a decade of investment in cutting-edge technology.

  • Experience the next-generation trading platform

Our state-of-the-art trading platform grants you unparalleled access to the CFD market and offers all of the necessary tools and features to optimize your experience and make the most out of your CFD trading. Our cloud-based technology ensures your access from any device and location. With servers and backups around the globe, you are assured of anywhere anytime order execution.

  • 24-hour support center

We are dedicated to offering best-of-breed support and believe that ultimately, our success is measured by our clients’ success. Our commitment to high quality customer service is thus both a driving force and a manifestation of this understanding. Our friendly and experienced 24-hour support team offers comprehensive solutions for all customer requirements.

  • Get ahead with unique and innovative trading tools

To ensure that our clients have the best tools available to make smart and informed trading decisions, we offer the following online features:

| Economic Calendar | Technical Analysis | Market Review | Real-time charts | Push notification services

  • Enjoy a wide range of financial Instruments

We provide the most comprehensive trading environment possible for our clients! We offer the opportunity to trade CFDs on the widest range of underlying assets available, including: Shares, Commodities, Forex, Indices and ETFs.

Segregated Clients’ Funds

At Xtrade, you will trade with peace of mind. Our protective measures include the following:

  • Stability and Financial strength of Xtrade Financial Services
  • Segregated Client Accounts
  • Investor Compensation Fund

 Segregated Accounts

Safety of client money is one of XTrade’s highest priorities. Client money is held in segregated accounts with Barclays, Commonwealth and other stable tier 1 Banks, separate than the Company/Group bank accounts so no matter what,  clients gets their money back.

Award-Winning Platform

Our best-of-breed technology and customer-first attitude continues to gain international acclaim. Acknowledgement of Xtrade’s dedicated representatives delivering of service and value spans the globe.

Xtrade Group of Companies :
Our group of companies through its subsidiaries is licensed in,
in Belize by the Financial Services Commission of Belize ‘’FSC’’ (Xtrade International Ltd – License Number FSC000281/481) ,
in South Africa by the Financial Sector Conduct Authority ‘’FSCA’’ (Peak Wealth PTY Ltd – License Number 2013/007163/07,
and in Australia by the Australian Securities and Investments Commission ‘’ASIC’’ (Xtrade Pty AU– AFS License Number 343628).

Brexit & Q3 Earnings Report with Data Deluge.

Brexit & Q3 Earnings report with Data Deluge.

The Market’s response to the ongoings with Brexit, Q3 Earnings Report, US-China Trade saga and Middle – Eastern tension are all familiar phenomenon, while we have expounded at length in previous articles and post. Caution is still warranted as the rewards are sweet, the losses are also very real.

It remains that until the Brexit “Deal” & The US/EU/China trade saga are resolved with some written documentation to fall on, uncertainties dominate, swinging the pendulum in favor of the bulls or bears depending on the day’s narrative and interpretation of some market participants.

The Brexit: As Prime Minister Johnson and the EU echo progress with a solution to a “Hard Brexit” (leaving the EU without a deal). Market participates flocked to the GBP and FTSE 100. Increased bets sent the pound to its highest levels in recent times. Uptrends are contingent on concrete developments else gains may be trimmed.

US & China: Following a reconciliatory tone between the two biggest world economy, which bolstered global stocks at the beginning of the week hangs in the balance after China agreed to a Partial Deal with the US purchasing more US agricultural-based produce, does not wish to continue the trade negotiations if the US does not waiver or remove tariffs from the table.   Meanwhile, an open front between the EU & the US on trade negotiations persists. Rocking global stocks in tandem.

Global Stocks:

Were observed up trending with the exception of the Australian Markets which were lagging.

  • WALLSTREET: Bolstered by Earning reports, and upbeat trade talks which may subside due to a snag in the trade negotiations volatility is abounding albeit with room to capitalize on gains by scalping between the resistance and support.   

USA30: Earnings report from the likes Netflix, & Tesla to name a few boosted to stocks coupled with developments between the UK & EU. However, upside movement may be confined to the day highs at 27,086.0 an open of 26,935.0. Trading is likely to range between 26,876.0 – 27,086.0

  • THE EU MARKET:  Were seen bullish.

Germany30: Gains wings by the time of print 11:50 GMT trading between 12,631.0 – 12,807.0 up 0.40% at 12,701.5 at this stage trends may head to the support levels before correcting up.

Italy40: Was up 0.18% at 22,437.5 after rallying to the day’s highs t 22,607.50 oscillation between 22,320.00 – 22,607.50 plausible The RSI indicates a strong tendency for the trends to be limited into the comfort zone between the 30 & 70 thresholds. 

UK100: The twitter announcement from EU’s President Jean-Claude Junker confirming a last-ditch deal between the UK and EU paved way for an optimistic bunch of bulls to jump on the FTSE although the deal still needs the approval of parliament and the Irish border bone of contentions resolved. Stocks were observed up. 0.41% at 7,176.8 lurking in a range between 7,135.2 – 7,216.0

  • ASIAN MARKET: Were mixed most of the Australian markets were pulled down perhaps due to China’s instance that a way forward with the trade negotiation must not include tariffs from the US and perhaps from the downbeat economic reports.  

HongKong50: Caught stretching it wings at 26,924.0 ranging between lows at 26,710.0 and highs at 27,016.0

Malaysia 70: Had made some impressive moves grossing the 14 k threshold, however, the upside is now curbed pending further support. Trading between 14,208.49 – 14,106.32 down 0.19%at 14,137.17 like to revolve around this number for a while.

Commodities:

In recent time the usual correlations and inverse correlation between the commodities and the USD has been “funky” some metals fall while others rally on geo-politics

Oil:

The Oil reports revealed content built in the Oil stockpiles and inventories with Saudi Arabia back to full production ramped up by the US increased production activities in a world where demand output is diminished. Threats to supply seem to have very limited upside effect with the trading ranging between 52.64 – 53.47 at the time of print WTI prices were down 0.97% at 52.84. A further downside could be in the pipelines before Friday’s profit-taking.

Gold: In our previous post we remarked the following,

“Caught indecisive between 1,508.85 -1,522.15 do not be surprised to see abrupt slides possible to recent lows around 1,498.00 before correcting if China and the US make any advancement in the trade negotiation.” 

Today Gold opened at 1,493.95 and projected to trade in between 1,487.05 – 1,499.85 If market participants feel they have been taking for a ride again with no concession to the China-US trade deal nor Brexit. Traders will run to take cover with the safe havens. Pushing Gold prices to possible highs above the 15k threshold.

FX Market:

Experienced major paradigm shifts, driven by Brexit and various trade sanctions leading to various Central Bank adjustments. The DXY was seen down trending, which reveals the GBP and EUR gaining grounds against the greenback even though it remained close to all times highs in the 108 zone.

USD/JPY: Seen ranging between highs of 108.94 and lows at 108.48 at 108.73. The pair may have paved out its trading cycle for the day. 

EUR/USD: The EUR stood tall against the USD up 0.47% at 1.1122 aim to stay close to the day’s highs at 1.1139 from the previous close at 1.1070. downside to 1.1065 the day’s support may not be seen today.

GBP/USD: News of a possible Brexit deal ahead of the 31st October deadline resounded well amongst traders on the bullish side of the equation sending the pound to highs, shay away from the 1.3 thresholds. Trading between 1.2752 – 1.2988 caught at 1.2875 up 0.35% at the time of print.

For further details, please visit Xtrade.com. You may also leave your comments below.

Related links:

An Actively Charged Oil Day, With Automatic Data Processing, Earnings & More!

An Actively charged Oil Day, With Automatic Data Processing, Earnings & More!

In anticipation of heavily loaded economic events day. Which includes the highly, sort after US rate decision, The ADP Automatic Data Processing report on the private jobs report to gauge the US employment quotas. EIA crude oil and gasoline inventories as well as the EU GDP and CPI reports.

To further sizzle the tempo of the market, there are about 453 companies releasing their Q2 earnings report for Colgate-Palmolive Co. and more.

Global Stocks:

Global stocks were spotted with some correcting from Tuesday’s lows while others lay in a wait and see posture.

  • USA30: Was one of the stocks seen climbing in the early EU open by 10:15 GMT. It was trading up 0.24% at 27,229.0 between 27,187.0 and 27,256.0 further upsides may continue if the feds cut rates and the earnings reports from QUALCOMM may render support, our technical analysts provide thresholds with resistance levels at 27.287.00 and support levels at 27.115.00
  • Germany 30: After shedding over 2.0% Tuesday the DAX 30 was seen in correction mode up 0.34% by the time pf print 10:20 GMT at 12,155.8 tradings between 12,103.8 and 12,181.0 a 2nd resistance is projected at 12,190.5. It is noteworthy to take into account the technical denotation with the resistance levels at 12.460.00 and support levels at 12.295.00
  • UK100: Has been amongst the losers. Seen trading down 0.43% at 7,557.3 between 7,546.2 -7,597.5 further downside to the technical support of 7.510.0 and even to 7,495.0 may be possible.
  • Italy 40: was seen up trending with most of the EU stocks. Caught at 21,327.50 up 0.19% Trading between 21,269.50-21,362.50 a 2nd resistance is noted at 21,410.50 and a 3rd possible technical resistance at 21.630.00.

Commodities:

Our usual selected assets in the commodities arena have been bullish since Tuesday. However, caution is warranted   

  • Oil: Tuesday the API reported a drop of over 6 million barrels in stockpiles, this kept WTI oil prices supported. Ahead of the day Oil and gasoline inventories prices were seen extending gains in case the EIA’s report beats market expectation prices may remain hawkish however perhaps contained below the $ 60.00bbl. observed at 58.26 up 0.36% by 10:35GMT. Ranging from the day’s open price at 58.34 heading to possible highs at 58.80. The technical threshold stands between 59.20 lows & 58.40 highs.
  • Gold: Remains supported amid unsettling Geopolitics, and the possibility of a Fed rate cut could send the price up, Today, knee jerks are expected. Trading between 1,428.60 -1,433.40. The technical analysis suggests the resistance levels at 1.435.00 & support levels at 1.419.00.

FX Market:  

The Forex market could be said to be restless.

  • USD/JPY: Trading vicariously in a range between 108.49 – 108.66 mostly sideways. At the time of print standing at 108.57 down 0.02%

  • EUR/USD: Stood at 1.1146, trading between 1.1143-1.1162 down 0.06%

  • GBP/USD: After plummeting to almost 2.5years lows. The GBP was seen correcting to the upside especially with the FTSE100 caught in a snare. Seen up 1.2167 up 0.15% between 1.2147 -1.2178

The Cryptocurrencies.

BTC/USD as per Tuesday post in predicting upside movements for this pair. Today they were noted up 4.10% trading between 9,520.0 – 10,030.0.

Most of the other token namely ETH, XRP was indicating bullish undertones

Further details, please visit Xtrade.com. You may also leave your comments below.

Related links:

An Overview Report Of US – China’s Trade War Effect On Safe Havens In 2019’s Q2

It is a known phenomenon that when the financial markets witness an economic “crisis” such was experienced in the markets recently between, the US and China’s “Trade War,” a large percentage of market participants prefer to put their capitals and investments in safe havens whether it is precious metals or currencies.

In this report, we will attempt to reveal how we have analyzed the safe havens technically and fundamentally from April to June 2019 “Q2”.

Japanese Yen

Sell USD/JPY

  • The best entry point maybe: 111.43

Stop Loss: 111.75

Take Profit: 109.70 or waiting to see if the price movement will break the support level “109.70” or not.

  • The best date: 3rd May 2019

The best entry point may be: 109.580

Stop Loss: 109.750 or if the price movement breaks the trend line.

Take Profit: 108.100 or waiting to see if the price movement will break the support level “108.100” or not. 

  • The best date: 30 May 2019

The best entry point may be: 107.640

Stop Loss: 108.100

Take Profit: 107.200 or waiting to see if the price movement will break the support level “107.200” or not. 

  • The best date: 20 June 2019

25 June 2019 was the best date for taking profits and close all sell positions in any points or levels above the support level 107.200.

Gold

Buy Gold

The best entry point may be: 1288.00

Stop Loss: 1278.00

Take Profit: 1315.00 or wait and see if the price movement breaches the resistance level “1315.00”  

  • The best date: 30th May 2019

The best entry point may be: 1325.00

Stop Loss: 1312.00

Take Profit: 1341.00 or wait and see if the price movement breaches the resistance level “1341.0

  • The best date: 4th June 2019

The best entry point may be: 1346.00

Stop Loss: 1336.00

Take Profit: 1405.00 or wait and see if the price movement breaches the resistance level “1405.0

  • The best date: 18th June 2019

The best entry point may be: 1408.00

Stop Loss: 1400.00

Take Profit: 1435.00 or wait and see if the price movement breaches the resistance level “1435.0“.

  • The best date: 24th June 2019

25 June 2019 was the best day for profit-taking while closing all possible buy positions, under the resistance level 1435.00.

Swiss Franc

Sell USD/CHF

The best entry point may be: 1.01488

Stop Loss: 1.02050 or if the price movement breaks the trend line.

Take Profit: 1.00050 or waiting to see if the price movement will break the support level “1.00050” or not. 

The best date: 10th May 2019

The best entry point may be: 0.99687

Stop Loss: 1.00100

Take Profit: 0.98677 or waiting to see if the price movement will break the support level “0.98677” or not. 

The best date: 3 June 2019

Buy USD/CHF

The best entry point may be: 0.99000

Stop Loss: 0.98500

Take Profit: 1.0005 or wait and see if the price movement breaches the resistance level “1.0005” or not. 

The best date: 10th June 2019

Sell USD/CHF

The best entry point may be: 0.99400

Stop Loss: 1.00100

Take Profit: 0.98677 or wait and see if the price movement breaches the support level “0.9867

The best date: 20 June 2019

The best entry point may be: 0.9814

Stop Loss: 1.00100

Take Profit: 0.97300 or wait and see if the price movement breaches the support level “0.9730

The best date: 21st June 2019

25 June 2019 was the best day for profit-taking while closing all possible buy positions, above the support level of 0.9730.

Cryptocurrencies: (The Odd ones In)

The cryptocurrencies market has also enjoyed some impressive upside trends from April to June 2019. Ranging from 4.095.00 to 13.868.00″, Some Investors had used the Cryptos as a hedging option. Often the unwarranted attention. Imbuing, the Cryptos as quasi safe-haven feel although they are not officially, recognized as such.

Produced by: Ahmed@Xtrade.

Further details, please visitXtrade.comYou may also leave your comments below.

Related links:


https://blog.xtrade.com/everywhere-is-trade-war-or-effects-of-trade-war-with-flight-to-safe-havens/


https://blog.xtrade.com/markets-contemplate-on-the-reliability-but-not-the-sincerity-of-the-announcement-of-us-china-trade-truce/


https://blog.xtrade.com/changing-tides-changes-trends-trade-war-tapping-adds-to-market-apprehension/

Bull & Bears Tug Of War, Oil Hops, Global Stocks Move Into High Gear.

Here we go again with the Bull & Bears Tug of War, Oil hops, Global Stocks move into High Gear.

As market gathers momentum driving by emotions at times and short term swings ensued by the Trade Tariffs antics, oil politics and Brexit tweaking as the UK searches for a new leader to provide a solution or lead the UK out of the EU.

On Wednesday, the EIA, report on Oil and Gasoline Inventories support the API report on Tuesday in that there was a substantial built in the US Stockpiles and Inventory levels. This pulled prices down to the upside of the $50.90 bbl. before reports of a sabotaged attempt which mainstream media claim was an attack on two tankers in the Gulf of Oman. Caused a petite panic of supply cuts. The truth of the matter is this does not change a thing in current fundamentals which suggests prices should between $55 bbl. to $60 bbl. if it could not sustain a $65-$70 bbl. range.

 Global Stocks: remained mixed most trading in familiar territories however indicating hawkish characteristics.

  • UK100: By 11:30 GMT the time of print, the FTSE 100 Futures were seen up 0.29% trading between 7,340.8 -7,400.8 some may be overly bullish. However, our humble analysis standing at 7,385.8 some down trending will be noted.  
  • Germany 30: The German Stocks turned bullish up 0.56% by the EU open trading between 12,061.5 -12,200.5 with most of the action occurring between 12,177.5 & 12,188.00 scalping is warranted.
  • Italy 40: The Italian FTSE opened at 20,434.50 however by the time of print it had gained 0.67% trading between 20,382.00 -20,657.50. in this range, further upside is expected before coiling up on budgetary woes.  
  • USA30: Talks of fed rate cuts amid trade war tensions the Dow is seen trading in and out of gains. Today it mostly bullish. Trading from lows of 25,897.0 – 26,113.5 by the time of print there was not enough visibility standing up 0.29%, however, upside beyond the day resistance is very highly feasible.  
  • Commodities: 

Reflecting on Wednesday’s post,

The Commodities are also changing gears depending on which politics it’s tunned to. However, when trade woes are not looming it could be observed that a vast majority of the commodities are bullish”. This is in line with the day status quo!

  • Oil: WTI price began up trending after an over exaggerated sell-off Wednesday following reports of a small built up in inventories and stockpiles and fears of weak demand. It’s interesting to observe a shift to the upside based on tabloids news about two oil tankers that were attacked in the Gulf of Oman. Meanwhile, Aramco Saudi state-owned oil refinery has decided for the first time in history to unveil it’s earning in August this transparency step helps to foster trust in the OPEC group which Saudi a leading member. Crude oil prices were spotted climbing up nearly 3% from Wednesday’s dip to 52.67 up 2.99% from lows of 50.92 heading to highs of 53.10 maybe it could breach the day’s resistance to about 53.35 before containing itself. Extreme jumps will be just close to the $54 mark.
  • Gold: The precious metal got a fair deal of attention. Seen trading between 1,335.95 -1,342.65.  By the time of print, it was at 1,340.45 and very sensitive to gravitational pull. Even with spread betters with limited visibility jumping in and out of positions

FX Market:

  • GBP/USD: After stretching the USD the Cable was seen edgy and indecisive standing at 1.2676 up 0.01% with the intended range between 1.2663 – 1.2708
  • EUR/USD: The pair were caught bullish at 1.1291 up 0.04% trading from 1.1287-1.1304 With the RSI lurking around 68-70 down trending or corrections may be possible if the US reports on Jobless Claims and Housing Price index does not overly disappoint expectations.
  • USD/JPY: “The battle for dominance” it is being a challenging week for the pair with each yanking the other to their advantage. The pair were seen at 108.43 down 0.06% trading between 108.17 and 108.53 Once again scalping could be warranted.
  • The Cryptocurrencies.

So there was a delay in the forecast however here we are Thursday with the Crypto arena sizzling. The BTC/USD has noted at 8,088.3 with a trading range set between 7,937.0 -8,250.0 meaning by the time of print 11:50 GMT it had already reached it daily resistances and backing down. After which uptrends back to the day resistance or close to it is expected.

Further details, please visit Xtrade.com. You may also leave your comments below.

Related links: