
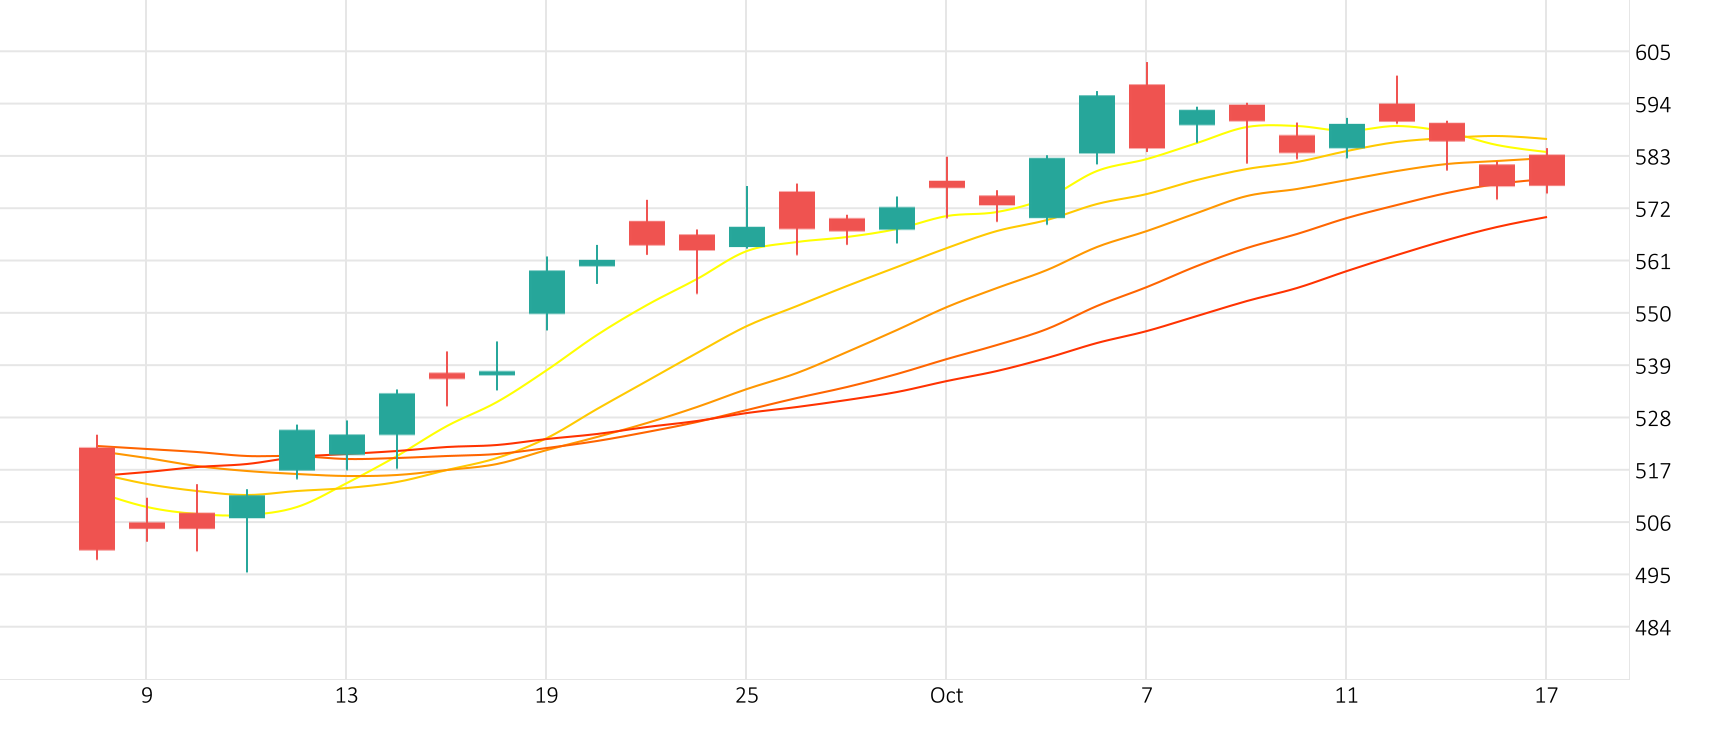
The last session saw Meta’s stock rise 1.7%. The RSI is giving a positive signal.
Meta shares rose 1.7% in the last session.
The RSI is giving a positive signal.
Support: 485.7066 | Resistance: 502.5266
The last session saw Meta’s stock rise 1.7%. The RSI is giving a positive signal.
Meta shares rose 1.7% in the last session.
The RSI is giving a positive signal.
Support: 485.7066 | Resistance: 502.5266
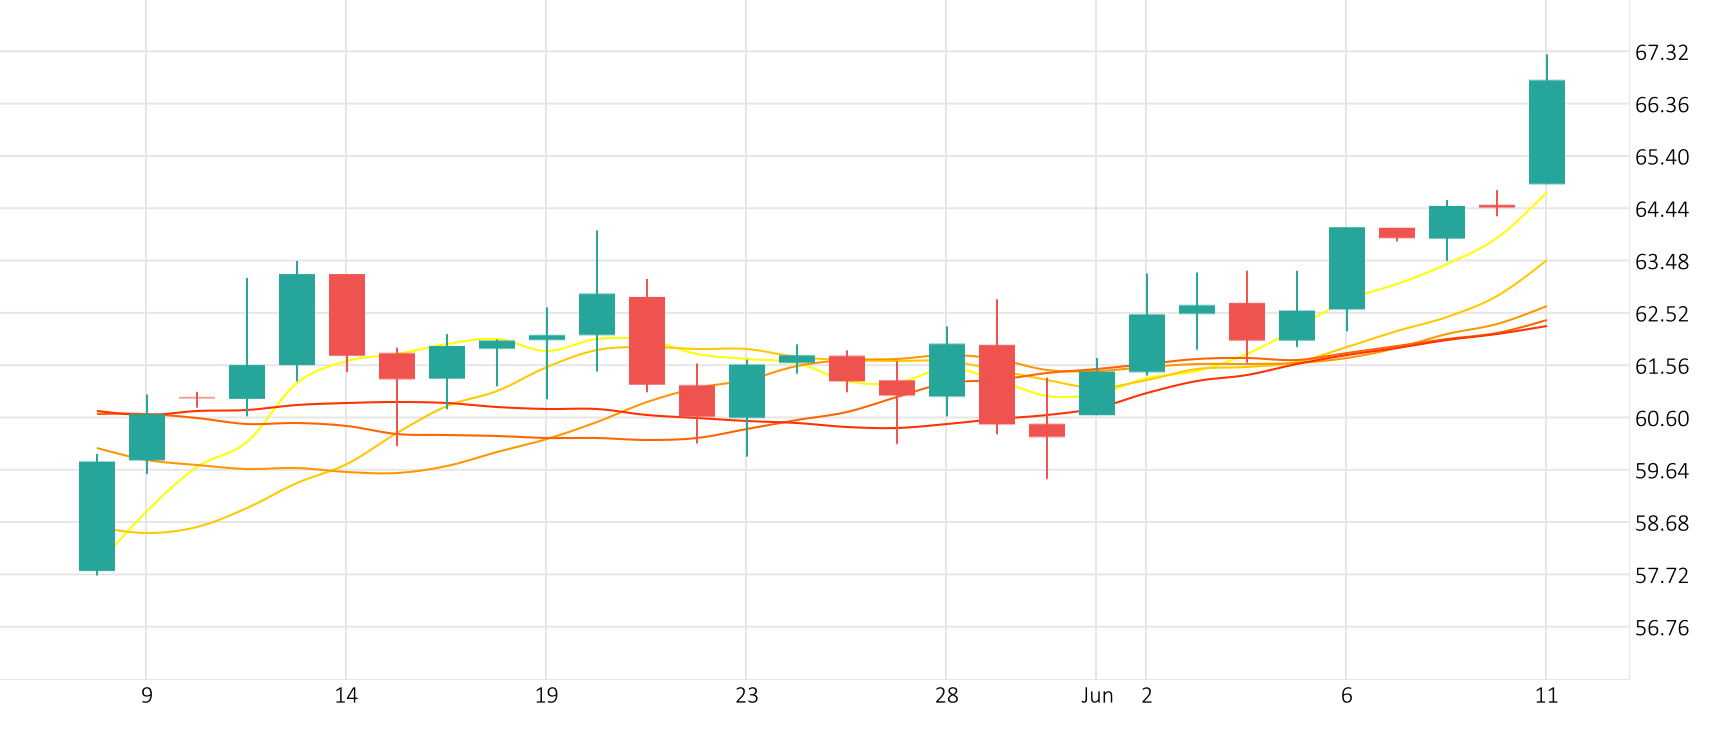
Oil prices climbed about 3% to a one-week high on Monday, buoyed by hopes of rising fuel demand this summer despite a stronger U.S. dollar and expectations the U.S. Federal Reserve will leave interest rates higher for longer.
The Oil-Dollar pair skyrocketed 3.8% in the last session. The Ultimate Oscillator is giving a positive signal.
Support: 75.261 | Resistance: 75.761
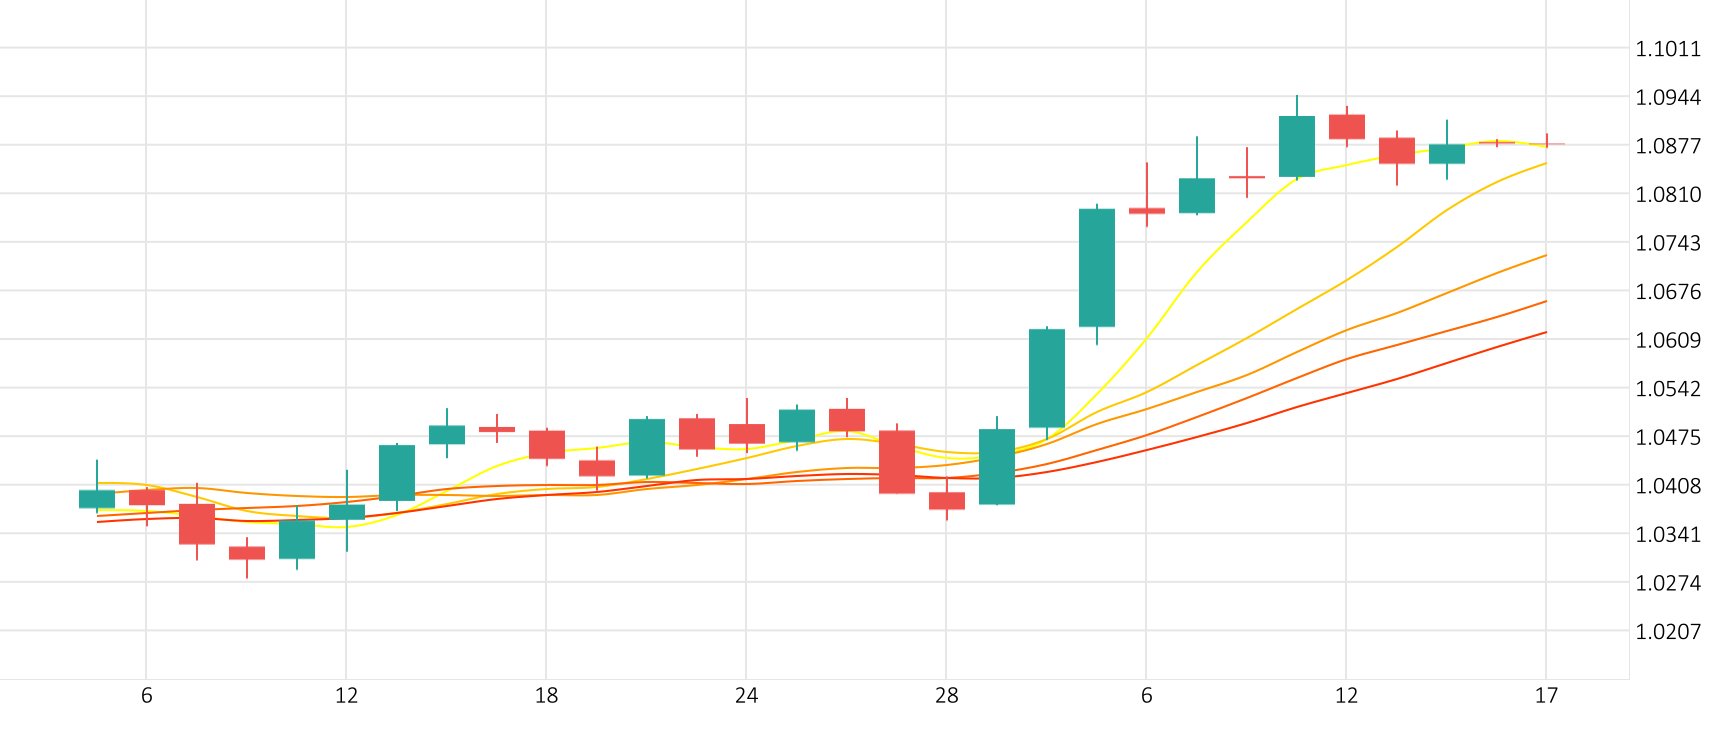
The euro fell after gains by the far right in European Parliament elections prompted French President Emmanuel Macron to call a snap national election. The uncertainty in France adds one more element to what will be a busy week for markets.
The Euro-Dollar pair saw a minor dip of 0.1% in the last session. The Williams indicator points to an oversold market.
Support: 1.0747 | Resistance: 1.0813
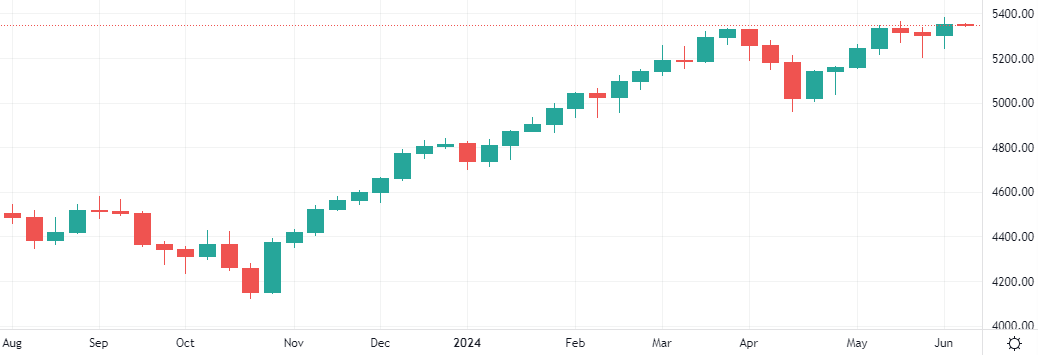
Investors will closely watch this week’s inflation numbers and Federal Reserve meeting for clues on whether the soft landing hopes that drove stocks to record highs are still justified. This year’s rally has lifted the S&P 500 up more than 12% year-to-date, on expectations the Fed can cool inflation without hurting growth
Gold accelerated declines after a stronger-than-expected U.S. jobs report doused expectations for U.S. interest rate cuts this year, adding to bearish sentiment driven by data showing top consumer China held off on bullion purchases in May.
The Gold-Dollar pair dove 3.4% in the last session. The CCI points to an oversold market.
Support: 2344.2851 | Resistance: 2394.2351
The Arbitrum Foundation, the team responsible for the Ethereum rollup-based layer-2 network Arbitrum, has committed substantial resources to developing the gaming industry within its ecosystem. The proposal sets aside 225 million Arbitrum tokens valued at approximately $215 million to be distributed over three years through the newly established Gaming Catalyst Program.