The
currency market is a dynamic and ever-changing landscape, and market participants
are always looking for opportunities to profit from the fluctuations of
different currencies. As we navigate through 2023, both the Japanese yen (JPY)
and the Chinese yuan (CNH) are reaching their lowest levels since the global
financial crisis of 2008.
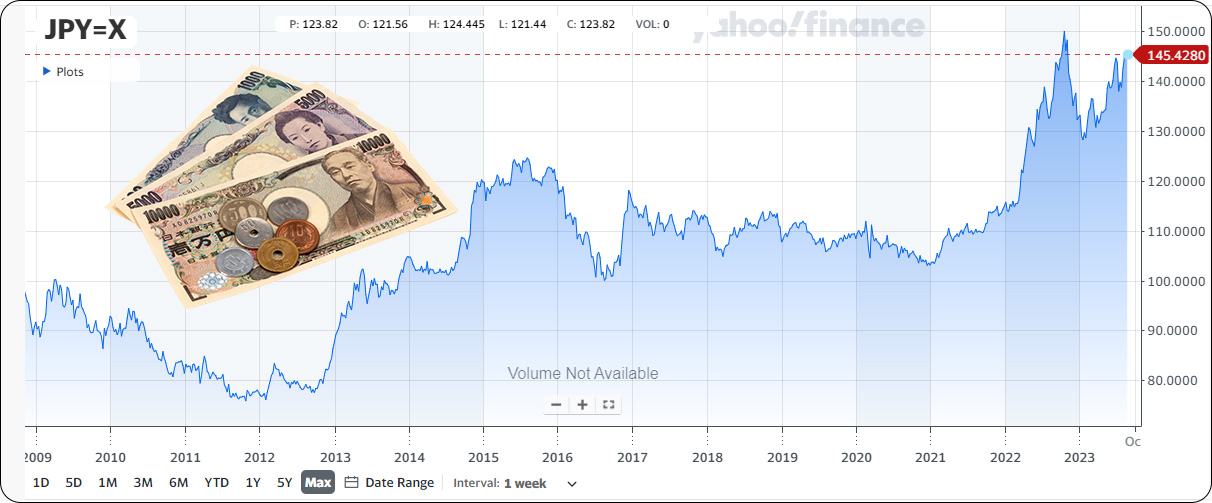
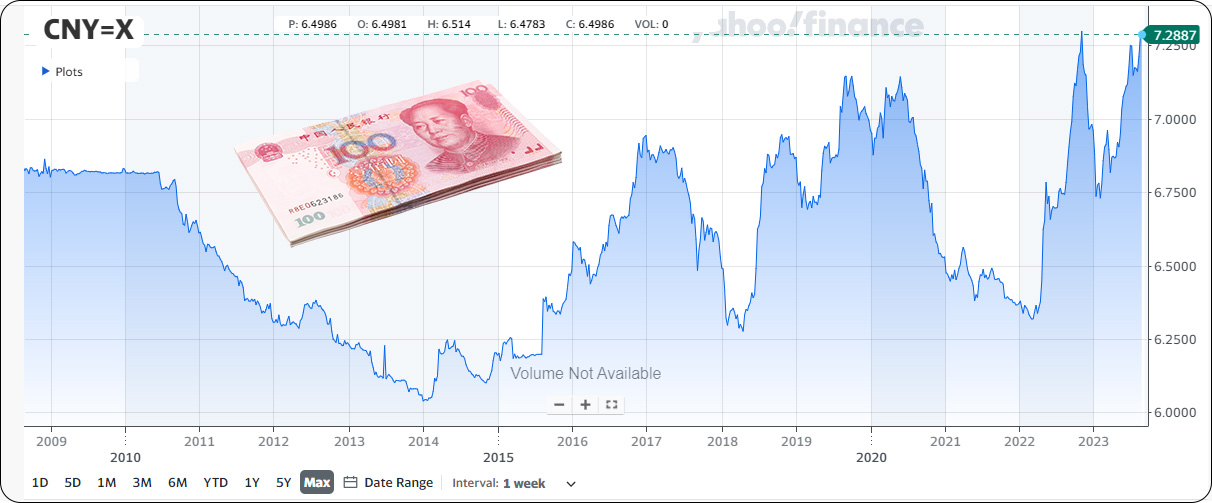
There are a number of factors that suggest that the US dollar could continue to strengthen against the Japanese yen (JPY) and the Chinese yuan (CNY). This could create an opportunity for investors to short these currencies, which means betting that their value will decline.
USD against Japanese Yen weekly Chart USD against Chinese Yuan weekly Chart
The
Robust US Dollar
There are a
number of reasons why the US dollar is expected to remain strong in 2023.
First, the Federal Reserve (Fed) has been raising interest rates in an effort
to combat inflation. This has made US dollar-denominated assets more attractive
to investors, as they offer higher yields. Second, the US economy is still
relatively strong, despite some recent headwinds. This makes the US dollar a
more attractive currency for investors who are looking for a safe haven.
Furthermore, the ongoing conflict in Ukraine fosters an environment of
uncertainty, solidifying the dollar’s position as a dominant player in currency
markets.
The
Weakening Yen and Yuan
Both the
Japanese yen and the Chinese yuan have recently weakened against the US dollar.
Since mid-January this year, the yen and yuan have fallen by about 10% against
the US dollar. Several factors contribute to this weakening, including:
The Bank of
Japan’s (BoJ) continued commitment to loose monetary policy, which has made the
yen less attractive to investors.
The Chinese
government’s efforts to prop up the yuan, which have been met with limited
success.
Concerns
about the economic outlook for both Japan and China.
The
Opportunity to Short the Yen and Yuan
The
combination of a robust US dollar and weakening yen and yuan presents investors
with an opportunity to short these currencies. Shorting a currency entails
betting on its value declining. If the yen or yuan weakens further, investors
who have shorted these currencies could realize substantial profits.
However,
it’s essential to recognize that currency markets are volatile and can rapidly
shift in either direction. Investors considering shorting currencies should
thoroughly understand the associated risks and proceed only if they possess a
strong grasp of currency market dynamics.
Conclusion
In summary,
several factors suggest that the US dollar could continue its strengthening
trend against the yen and yuan in 2023. This potentially creates an opportunity
for investors to short these currencies. However, it’s important to acknowledge
that markets can reverse direction due to various circumstances.
Disclaimer:
The information provided in this article is for informational purposes only and
should not be considered as financial or investment advice.
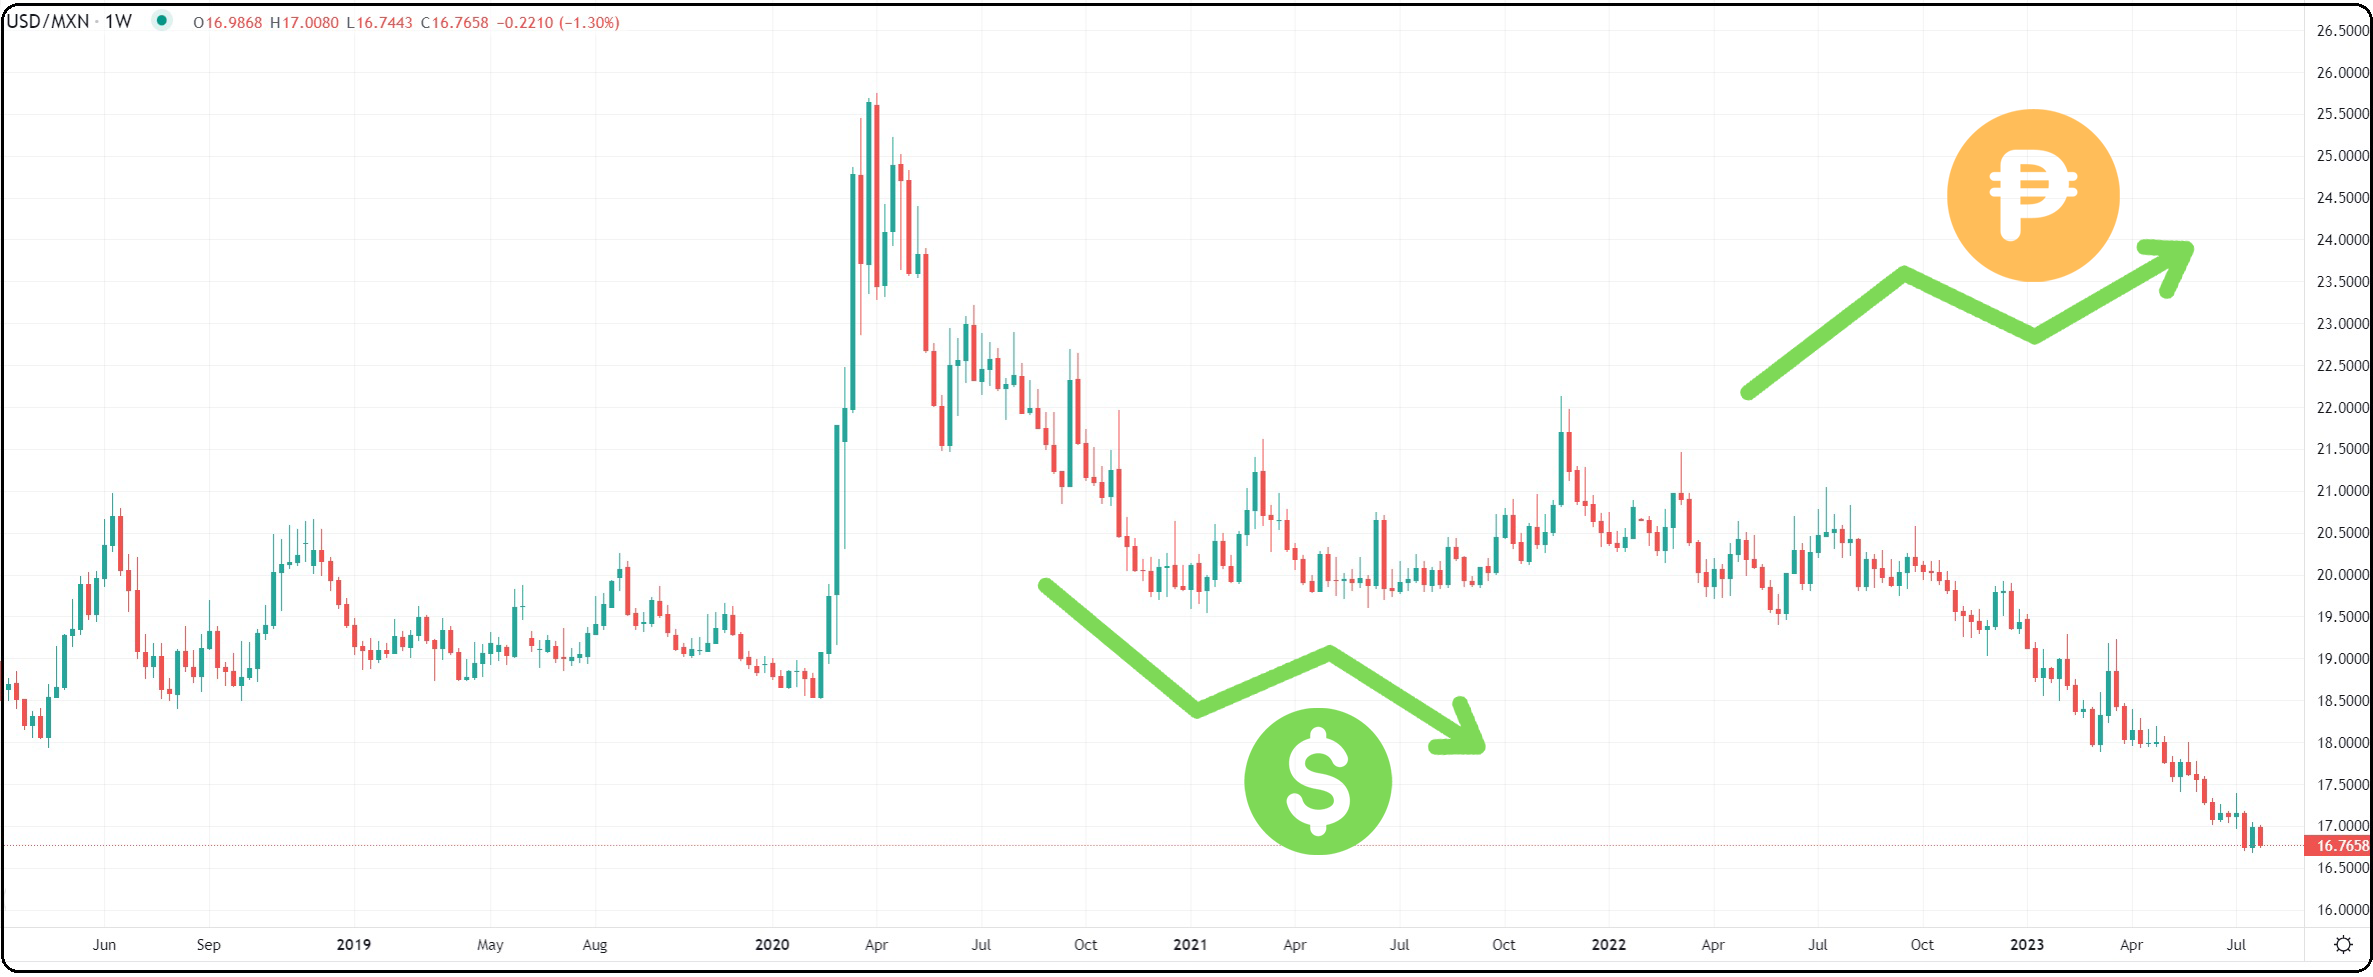
The Mexican
peso is one of the best-performing currencies in recent years, it has
appreciated more than 10% against the dollar, euro since the beginning of the
year.
Forex – USD/MXN Chart
Introduction:
The Mexican
Peso (MXN), the official currency of Mexico, has gained substantial attention
from traders owing to its remarkable appreciation since April 2020. In this
blog, we will explore the performance of the Mexican Peso, analyze the factors
shaping its value, and uncover the reasons behind its allure for traders
seeking lucrative opportunities in the forex market.
Performance
of the Mexican Peso:
The Mexican
Peso has exhibited resilience and strength in the face of economic challenges,
showcasing impressive performance against other major currencies. Since
reaching a low point in April 2020, the Peso has surged more than 35%,
attracting traders’ interest and positioning itself as a prominent player in the
financial markets.
Factors
Influencing the Mexican Peso:
The robust
performance of the Mexican Peso can be attributed to several key factors:
Strong Economic
Recovery: Mexico’s economy has been witnessing a robust recovery from the
pandemic-induced slowdown. As the nation’s economy gains momentum, investors
are increasingly drawn to the potential for higher returns, thus driving up
demand for the Mexican Peso.
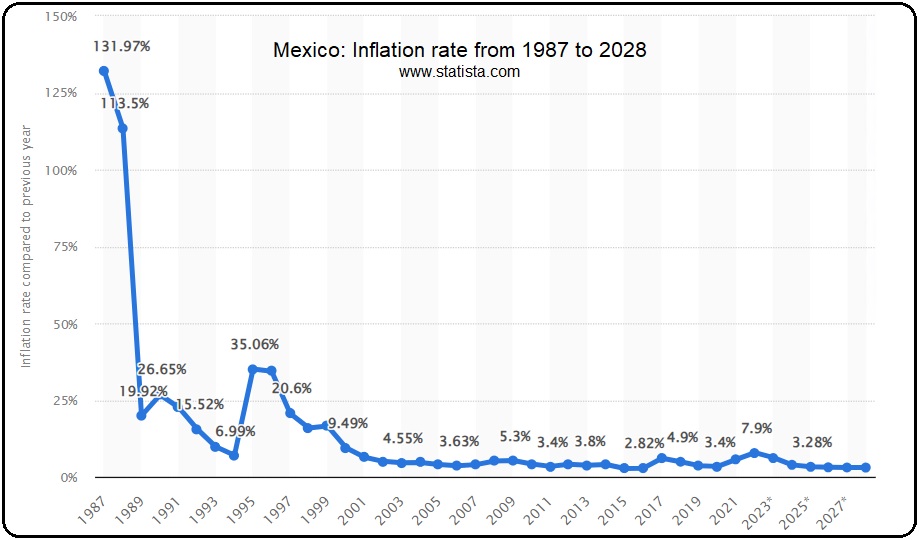
Slowing
Inflation: Mexico’s inflation rate has been on a downward trajectory, creating
a conducive environment for the country’s central bank to implement monetary
policies that support the stability of the Peso. Lower inflation contributes to
a more favorable investment climate.
According to
economists in the most recent Citibanamex survey published last week, inflation
at the end of 2023 is expected to be 4.66%, down from a forecast of 4.99% in
June. The core forecast estimates have also inched down to 5.17% from 5.30%.
Mexico’s inflation has continued its gradual slowdown in early July, aligning
with forecasts, aided by double-digit interest rates and a robust peso.
Mexico Inflation Rate
Improved
Investor Sentiment: Emerging market currencies, including the Mexican Peso,
have gained traction among investors due to improved sentiment. As global
investors seek higher yields and diversification, the Mexican currency emerges
as an attractive option.
Tesla and other
companies plan to open factories in Mexico, taking advantage of the country’s
low labor costs and strategic location, have bolstered investor optimism. The
opening of these factories could have several positive effects on the Mexican
economy, including job creation, increased exports, and improved business
climate. These factors could further strengthen the Mexican Peso.
Outlook and
Trading Opportunities:
The outlook for
the Mexican Peso remains optimistic, with traders closely monitoring the
currency for potential opportunities. The ongoing economic recovery is likely
to fuel the Peso’s upward trajectory, presenting favorable conditions for
profitable trades.
Conclusion:
The Mexican
Peso’s continued strength and positive outlook have captured the attention of
traders worldwide. With a resilient economy, decreasing inflation, and enhanced
investor sentiment, the Peso is well-positioned to sustain its upward
trajectory. Traders looking for promising opportunities in the forex market should
closely monitor the Mexican Peso, as it promises substantial gains amidst its
impressive performance. However, there
is always the risk of political instability. This could weigh on the peso if
it leads to uncertainty about the country’s future.
Disclaimer:
The information provided in this article is for informational purposes only and
should not be considered as financial or investment advice.
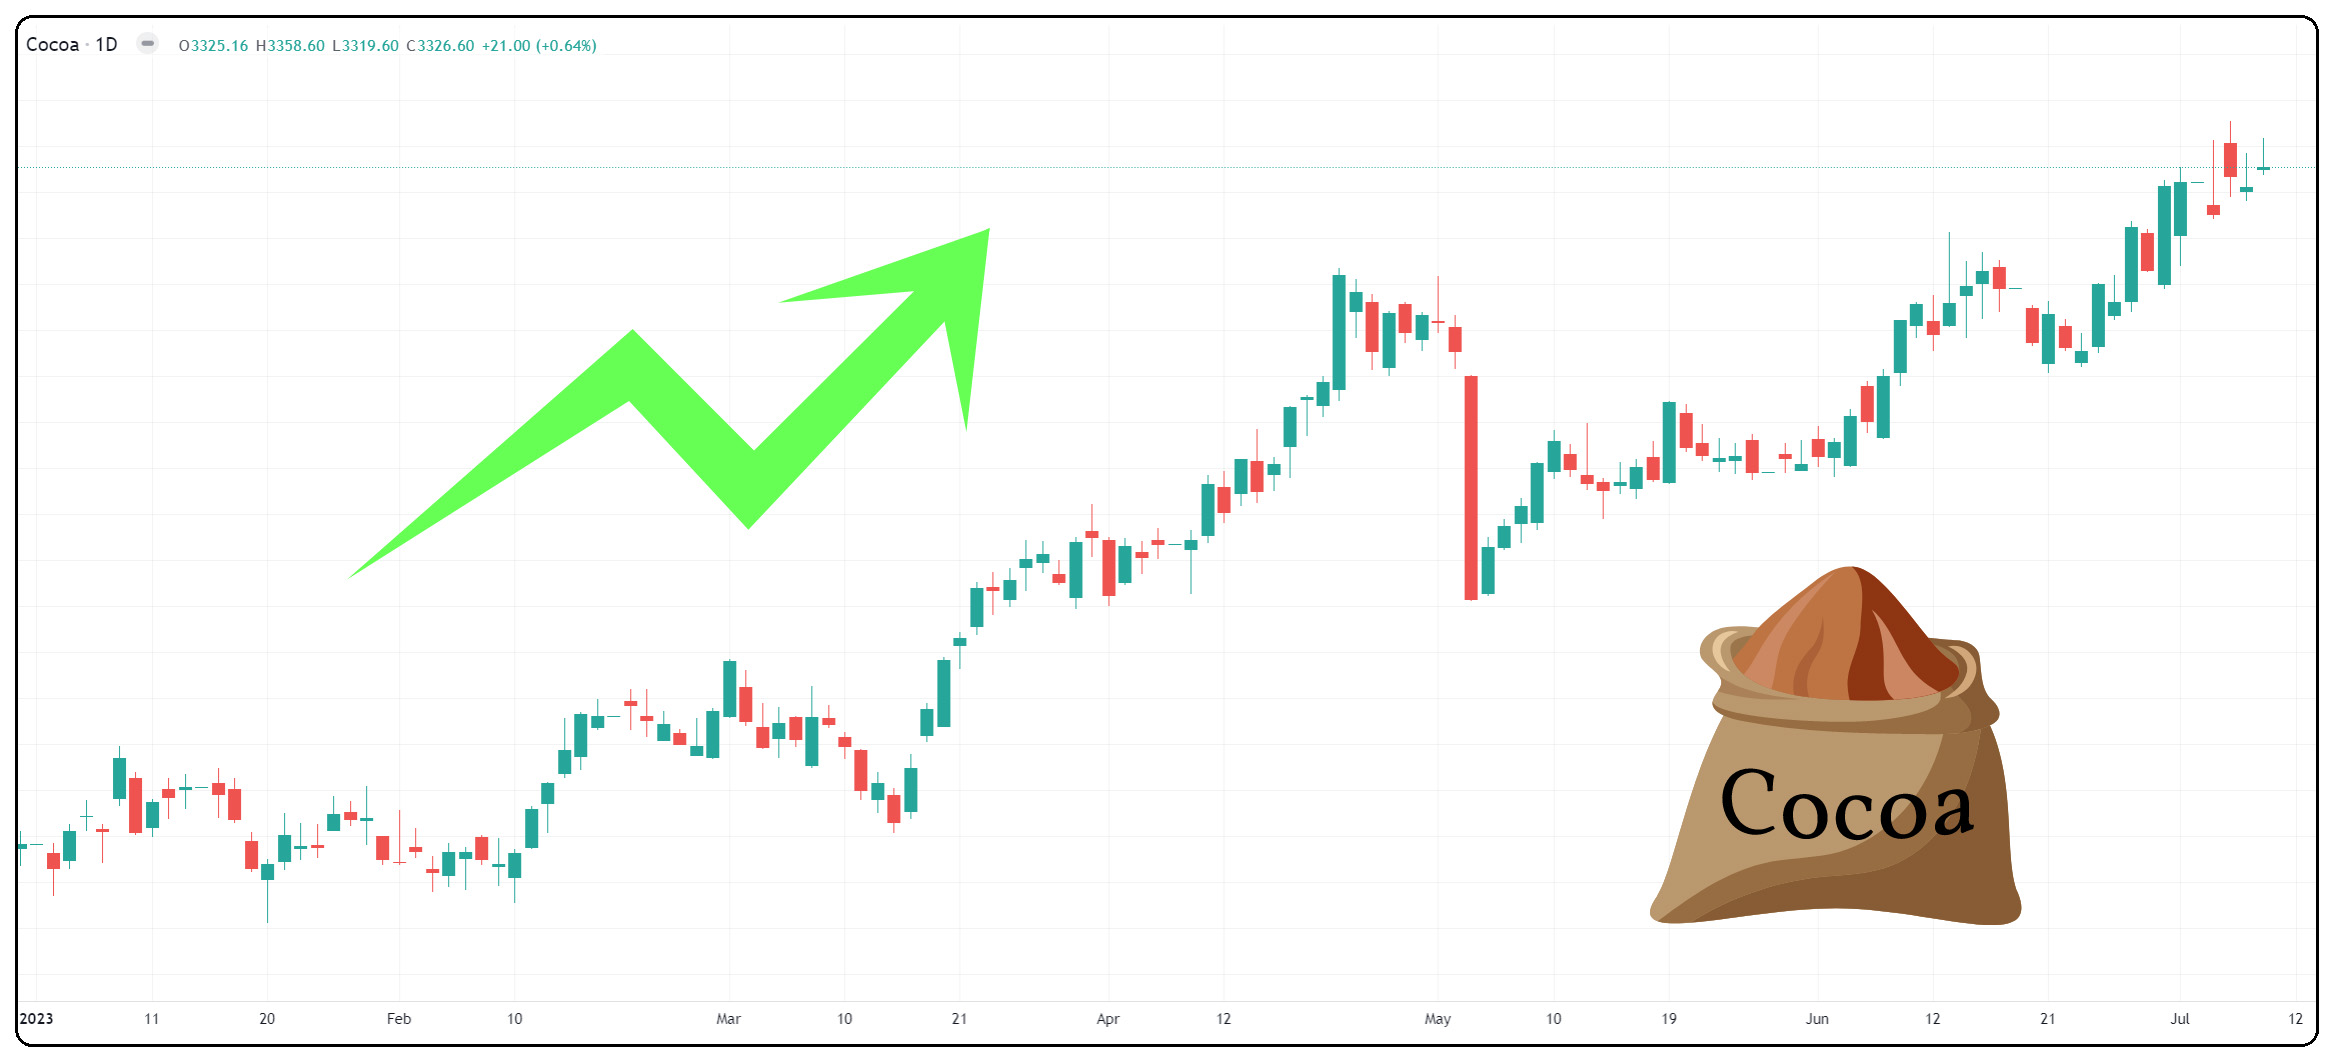
Chocolate is set to get more expensive as cocoa prices soar to seven-year highs. Cocoa price has risen by almost 30% in 2023.
Commodity – Cocoa Price Chart 2023
Introduction:
As cocoa prices continue to soar and the industry faces
supply concerns, many are wondering if cocoa is a good investment choice. In
this article, we will examine the factors driving the cocoa market and explore
the potential opportunities for investors.
Record Trading Volume and High Participation:
According to reports, the first half of 2023 witnessed a
record number of cocoa futures and options traded, indicating strong customer
engagement. Cocoa futures hit successive volume and open interest (OI) records,
reaching a record high of 1.4 million contracts on June 29, 2023. Furthermore,
participation in ICE’s New York and London Cocoa contracts is at its highest
since 2018, with record participation in ICE’s London Cocoa markets in June.
Supply Concerns and Demand Increase:
Persistent concerns of low supply from the world’s top cocoa
producers have contributed to the upward momentum of cocoa prices.
Above-average rain in the Ivory Coast and poor weather conditions in Ghana have
flooded plantations and hurt crop prospects, leading to a supply deficit. The
International Cocoa Organization forecasts a global supply deficit of 142,000
tonnes, more than twice the previous estimates. On the demand side, leading
companies like Hershey and Mondelez have experienced a surge in demand,
supported by the reopening of the global economy and growing middle class in
countries like China and Indonesia.
Market Performance and Predictions:
Cocoa prices have reached a 7.5-year high, hovering above
$3,300 per tonne. The price increase has been significant, with cocoa trading
~36% above the lowest level in 2022 and ~93% higher than its 2018 lows. This
surge in prices is attributed to ongoing supply and demand imbalances in the
industry. However, factors such as ageing cocoa farms, climate change, and
long-term buying contracts of major chocolate companies impact the market
dynamics.
Market Analysis and Potential Opportunities:
From a technical perspective, cocoa prices have shown a
strong bullish trend, breaking important resistance points and indicating
potential for further price gains. Traders should be aware of the possibility
of short pullbacks before the continuation of the bullish trend. The market
dynamics make cocoa an attractive option for investors looking to capitalize on
short-term and long-term price movements.
Conclusion:
As cocoa prices reach new highs and supply concerns persist,
investing in cocoa presents an interesting opportunity. Factors such as supply
deficits, increasing demand, and technical indicators support the potential for
further price gains. However, it’s essential for investors to consider the
unique market dynamics and factors that can impact cocoa prices. By staying
informed and understanding the risks and opportunities, investors can make
informed decisions in the cocoa market.
Disclaimer: The information provided in this article is for
informational purposes only and should not be considered as financial or
investment advice.
Virgin Galactic, the groundbreaking space tourism company,
has been capturing the attention of traders looking to harness short-term
profit opportunities. The company has been in business for over 20 years, and
it has recently made significant progress in developing its technology.
In 2021, the company successfully completed its first
commercial spaceflight, and it is now preparing to launch more flights in the
near future.
In this blog, we will explore the reasons why Virgin
Galactic can be a valuable option for short-term trading, allowing traders to
capitalize on its potential for rapid price movements and market sentiment.
Trading Opportunities:
Currently, with its low price and ability to react swiftly
to positive news, Virgin Galactic has become an enticing choice for those
seeking profitable short-term trades.
Three main reasons why Virgin Galactic
could be a good trading opportunity:
1. The company’s stock
price is very low.
2. There is a lot of
potential for short-term gains if there is any good news about the company.
The low price of Virgin Galactic’s stock could make it a
valuable choice for short-term trading. If the company announces any positive
news, such as the successful completion of another commercial spaceflight, its
stock price could go up significantly. However, it is important to remember
that short-term trading is a risky activity, and the stock price of Virgin
Galactic could go down when there is negative disclosure.
For short-term traders who are adept at capitalizing on
market dynamics and have a high tolerance for risk, currently, the low price of
Virgin Galactic shares can present enticing. Short-term traders who can
navigate the volatile nature of the stock may be able to capitalize on positive
news catalysts, such as successful test flights, regulatory approvals, or
high-profile partnerships. Especially when it has successfully completed a
commercial spaceflight, its stock price could go up significantly.
By staying abreast of the company’s developments and
carefully monitoring market sentiment, traders may find opportunities to profit
from short-term price movements.
Virgin Galactic’s stock price reached historical low below
$3 on April 6, 2023.
In June, the stock price of Virgin Galactic experienced a remarkable surge of over 80%, skyrocketing from $3.5 on June 1, to $6 on June 20, subsequent to the company’s late May announcement of their inaugural paid space tourism flight. Virgin Galactic has officially commenced commercial spaceflight service on June 15, 2023, with the first paying customers set to fly in August.
Virgin Galactic’s SpaceShipTwo vehicle is designed to carry
six passengers and two pilots to an altitude of over 50 miles, where they will
experience a few minutes of weightlessness and stunning views of Earth. The
entire spaceflight experience takes about 90 minutes. Virgin Galactic is
currently accepting reservations for spaceflights, with tickets starting at
$450,000. The company has sold over 800 tickets to date.
Compare to its historical high of $52 in 2021, there is a
lot of room for speculation and upside in stock prices.
Volatility as an Advantage:
Virgin Galactic’s stock has exhibited notable volatility
since its IPO, presenting traders with ample opportunities to profit from
short-term price swings. The stock’s propensity for sharp rises and falls can
create an ideal environment for traders to enter and exit positions swiftly. By
closely monitoring the company dynamic and leveraging technical analysis
techniques, traders can potentially identify advantageous entry and exit points,
maximizing their chances for profitable trades.
Catalysts for Price Movements:
Virgin Galactic’s stock price is highly responsive to
significant news events, making it an attractive choice for short-term traders.
Positive developments such as successful test flights, new partnerships, or
regulatory approvals often trigger rapid price surges. Traders who keep a close
eye on the company’s announcements and developments can position themselves to
take advantage of these catalysts. By staying informed and acting swiftly,
traders can ride the momentum created by positive news and potentially generate
substantial profits.
Technical Analysis Opportunities:
Virgin Galactic’s price chart provides ample opportunities
for traders to apply technical analysis strategies. The stock’s frequent price
swings, combined with identifiable patterns and indicators, offer traders a
framework for making informed trading decisions. Whether utilizing chart
patterns, trend analysis, or oscillators, technical analysis can aid traders in
identifying potential entry and exit points, optimizing their chances for
profitable trades in the short term.
Short-Term Trading Strategies:
Short-term traders have the opportunity to utilize a diverse range of strategies to take advantage of the price volatility exhibited by Virgin Galactic. One effective approach is day trading, which involves opening and closing positions within a single trading session. Given the stock’s low price, traders can leverage their positions and execute trades in both directions, aiming for higher profitability if the trade moves in their favor. By carefully selecting the most suitable strategy and adapting it to the prevailing market conditions, traders can align their trades with the stock’s price behavior and potentially generate consistent profits.
Long-Term Investment Risks:
Despite the allure of space tourism, Virgin Galactic has yet
to generate substantial revenue or turn a profit. The company’s shares soared
following successful test flights or positive announcements, only to plummet
when faced with setbacks or delays. Such unpredictable swings can be
detrimental to long-term investors seeking stability and consistent growth.
Conclusion:
Virgin Galactic’s stock offers an enticing opportunity for
short-term traders looking to capitalize on rapid price movements and market
sentiment. Its volatility, coupled with catalysts for price swings and
technical analysis opportunities, creates a favorable environment for
profitable trades. However, it is essential for traders to approach short-term
trading with diligence, employing risk management techniques, setting clear
profit targets and stop-loss orders, and being prepared to adapt swiftly to changing
market conditions. While short-term trading in Virgin Galactic may present
profitable opportunities, it is important to remember that it carries inherent
risks and should be approached with caution. By leveraging the stock’s
potential and applying sound trading strategies, traders can unlock valuable
short-term trading opportunities within the dynamic landscape of Virgin
Galactic.
Following President Erdogan’s victory in the election, the
Turkish Lira has experienced a significant decline in value. This blog explores
the factors contributing to the depreciation of the Turkish Lira, why veteran
traders are able to capitalize on these opportunities, and the importance of
knowledge in understanding and leveraging such market dynamics.
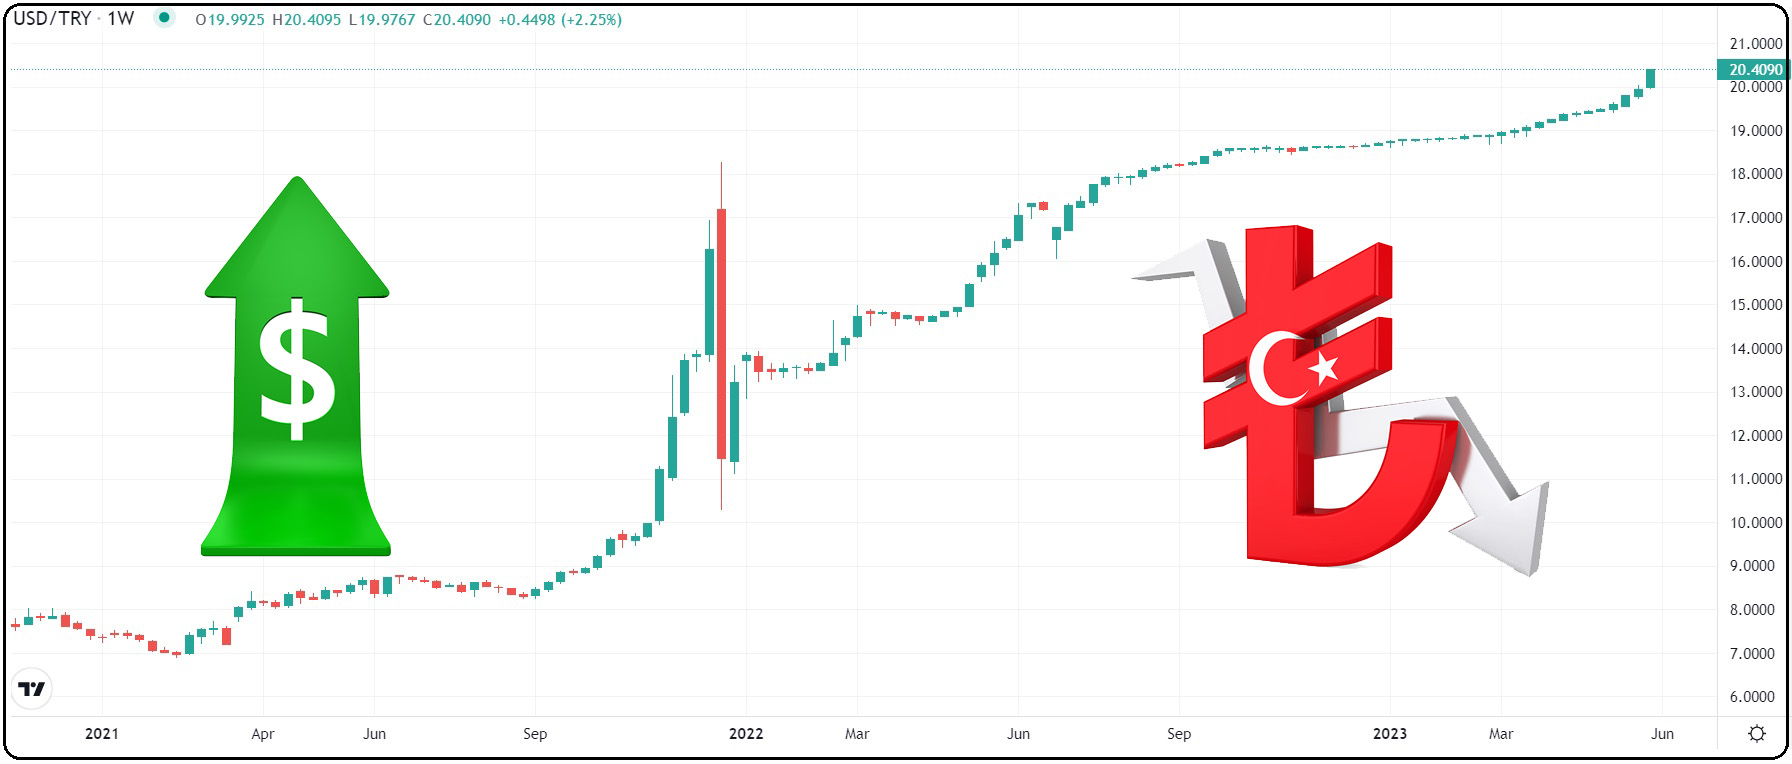
The Depreciation of the Turkish Lira:
The Turkish Lira has witnessed a decline against major
currencies, particularly the US dollar. It has reached record lows, with
exchange rates nearing 19 and even approaching 20 Lira per dollar. This
volatility has raised concerns among investors and triggered intense market
speculation. Since 2021, the US dollar against the Turkish Lira has nearly
tripled, rising from 7.4 to 19.8.
Factors Contributing to the Depreciation:
Several factors have contributed to the depreciation of the
Turkish Lira, including economic instability, political uncertainties,
geopolitical tensions, and inflationary pressures. These elements have created
a challenging environment for the Turkish economy, eroding confidence in the
Lira and resulting in capital outflows.
Economic Instability and Geopolitical Tensions:
Political uncertainties, trade disputes, and regional
conflicts have heightened market volatility, impacting the value of the Turkish
Lira. Veteran traders have closely monitored these developments, recognizing
the potential for profitable trading opportunities amid the market turbulence.
Inflationary Pressures:
High inflation rates have eroded the purchasing power of the
Turkish Lira, leading to depreciation. The Turkish economy has faced persistent
inflationary pressures, requiring intervention from the central bank to
stabilize the currency. Experienced traders have utilized inflation data to
inform their strategies and capitalize on price movements.
Economic Reforms and Structural Challenges:
Structural challenges within the Turkish economy, such as a
large current account deficit and heavy reliance on external financing, have
added to the volatility of the Turkish Lira. Economic reforms aimed at
addressing these challenges have been implemented, but their impact takes time
to materialize. Veteran traders, equipped with thorough analysis and
understanding of these reforms, have positioned themselves to seize trading
opportunities arising from the currency’s fluctuations.
Seizing Trading Opportunities:
While humanitarian aid has poured into Turkey, veteran
traders have also recognized the significant depreciation of the Turkish Lira
in recent years. Leveraging their experience and expertise, these seasoned
traders have made profitable investments amidst the currency’s fluctuations.
However, many individuals may have missed out on capitalizing on these
opportunities due to a lack of understanding and awareness.
Conclusion:
To trade USD/TRY successfully, continuous learning and
staying informed about market knowledge and awareness are essential. By
understanding market dynamics, monitoring economic developments, and gaining
expertise in analyzing factors influencing the Turkish Lira’s performance,
traders can position themselves to seize potential opportunities and navigate
the complexities of the global currency markets.
So, do you want to learn how to trade USD/TRY and make
predictions about its future direction?
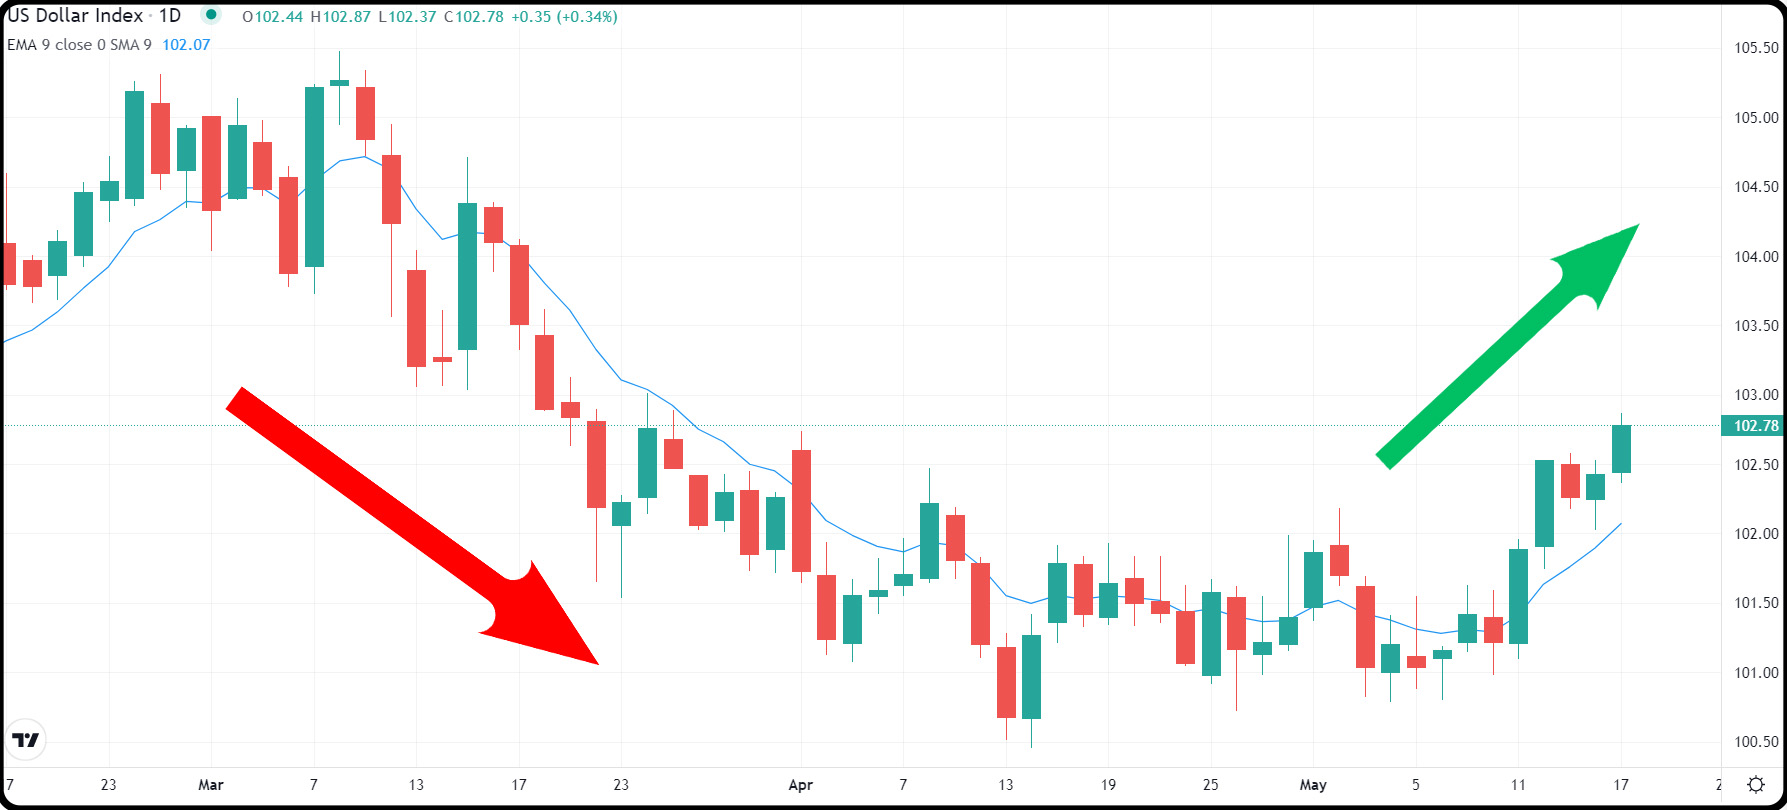
The US
dollar is currently experiencing a surge in popularity, presenting both risks
and opportunities for investors. One way to track the value of the dollar is
through the U.S. Dollar Index (USDX), an exchange-traded fund that measures its
strength against a basket of six major foreign currencies.
How
Strong Is the Dollar?
The US
Dollar Index compares the dollar’s value to the euro (EUR), Japanese yen (JPY),
British pound (GBP), Canadian dollar (CAD), Swedish krona (SEK), and Swiss
franc (CHF). As of May 17, here is how the dollar stands against these
currencies:
EUR/USD:
One euro is equivalent to $1.09, down from $1.10 on May 4, 2023.
USD/JPY:
One dollar is equivalent to 136.36 yen, up from 134.27 yen on May 4, 2023.
USD/CHF:
One dollar is equivalent to 0.89 Swiss francs, up from 0.88 francs on May 4,
2023.
GBP/USD:
One British pound is equivalent to $1.24, down from $1.25 on May 4, 2023.
USD/CAD:
One dollar is equivalent to C$1.35, with minor fluctuations since May 4, 2023.
Over the
past 2 weeks, the US dollar has generally gained strength against most major
currencies.
Looking
forward, the strength of the dollar will likely be closely tied to US inflation
and interest rates, according to Quincy Krosby, LPL Financial’s chief global
strategist.
Debt
ceiling stalemate
However,
recent concerns about the US debt ceiling have impacted the dollar’s
performance. Safe-haven demand due to a slowing Chinese COVID recovery and an
unexpected rise in US consumer inflation expectations boosted the dollar last
week. Yet, the focus has shifted to the looming borrowing limit, which Treasury
Secretary Janet Yellen has warned could be reached as early as June 1.
Investors are eagerly awaiting news from Washington on how the debt ceiling
issue will be addressed, as failure to resolve it could lead to a US government
debt default.
Emerging
markets
Meanwhile,
in emerging markets, the Turkish lira has seen a significant decline, nearing a
record low, as weekend elections appear headed for a runoff. On the other hand,
the Thai baht has rallied following a more decisive election result.
In
conclusion, the US dollar’s current trend is marked by its strength against
major currencies, influenced by factors such as inflation, interest rates, and
the looming debt ceiling issue. Monitoring these developments is crucial for
investors as they assess the risks and opportunities presented by the US
dollar’s performance.